Puerto Rico Labor Market Conditions Index
Overview What this dashboard measures
What you are looking at: a monthly summary of Puerto Rico's labor market conditions, combining 39 economic indicators into a single index using a dynamic factor model.
Methodology: The PR-LMCI follows the Chicago Fed Labor Market Conditions Index (Brave and Cole, 2014). It extracts the first principal component from a standardized panel of 39 indicators using EM-PCA to handle missing data.
Three outputs:
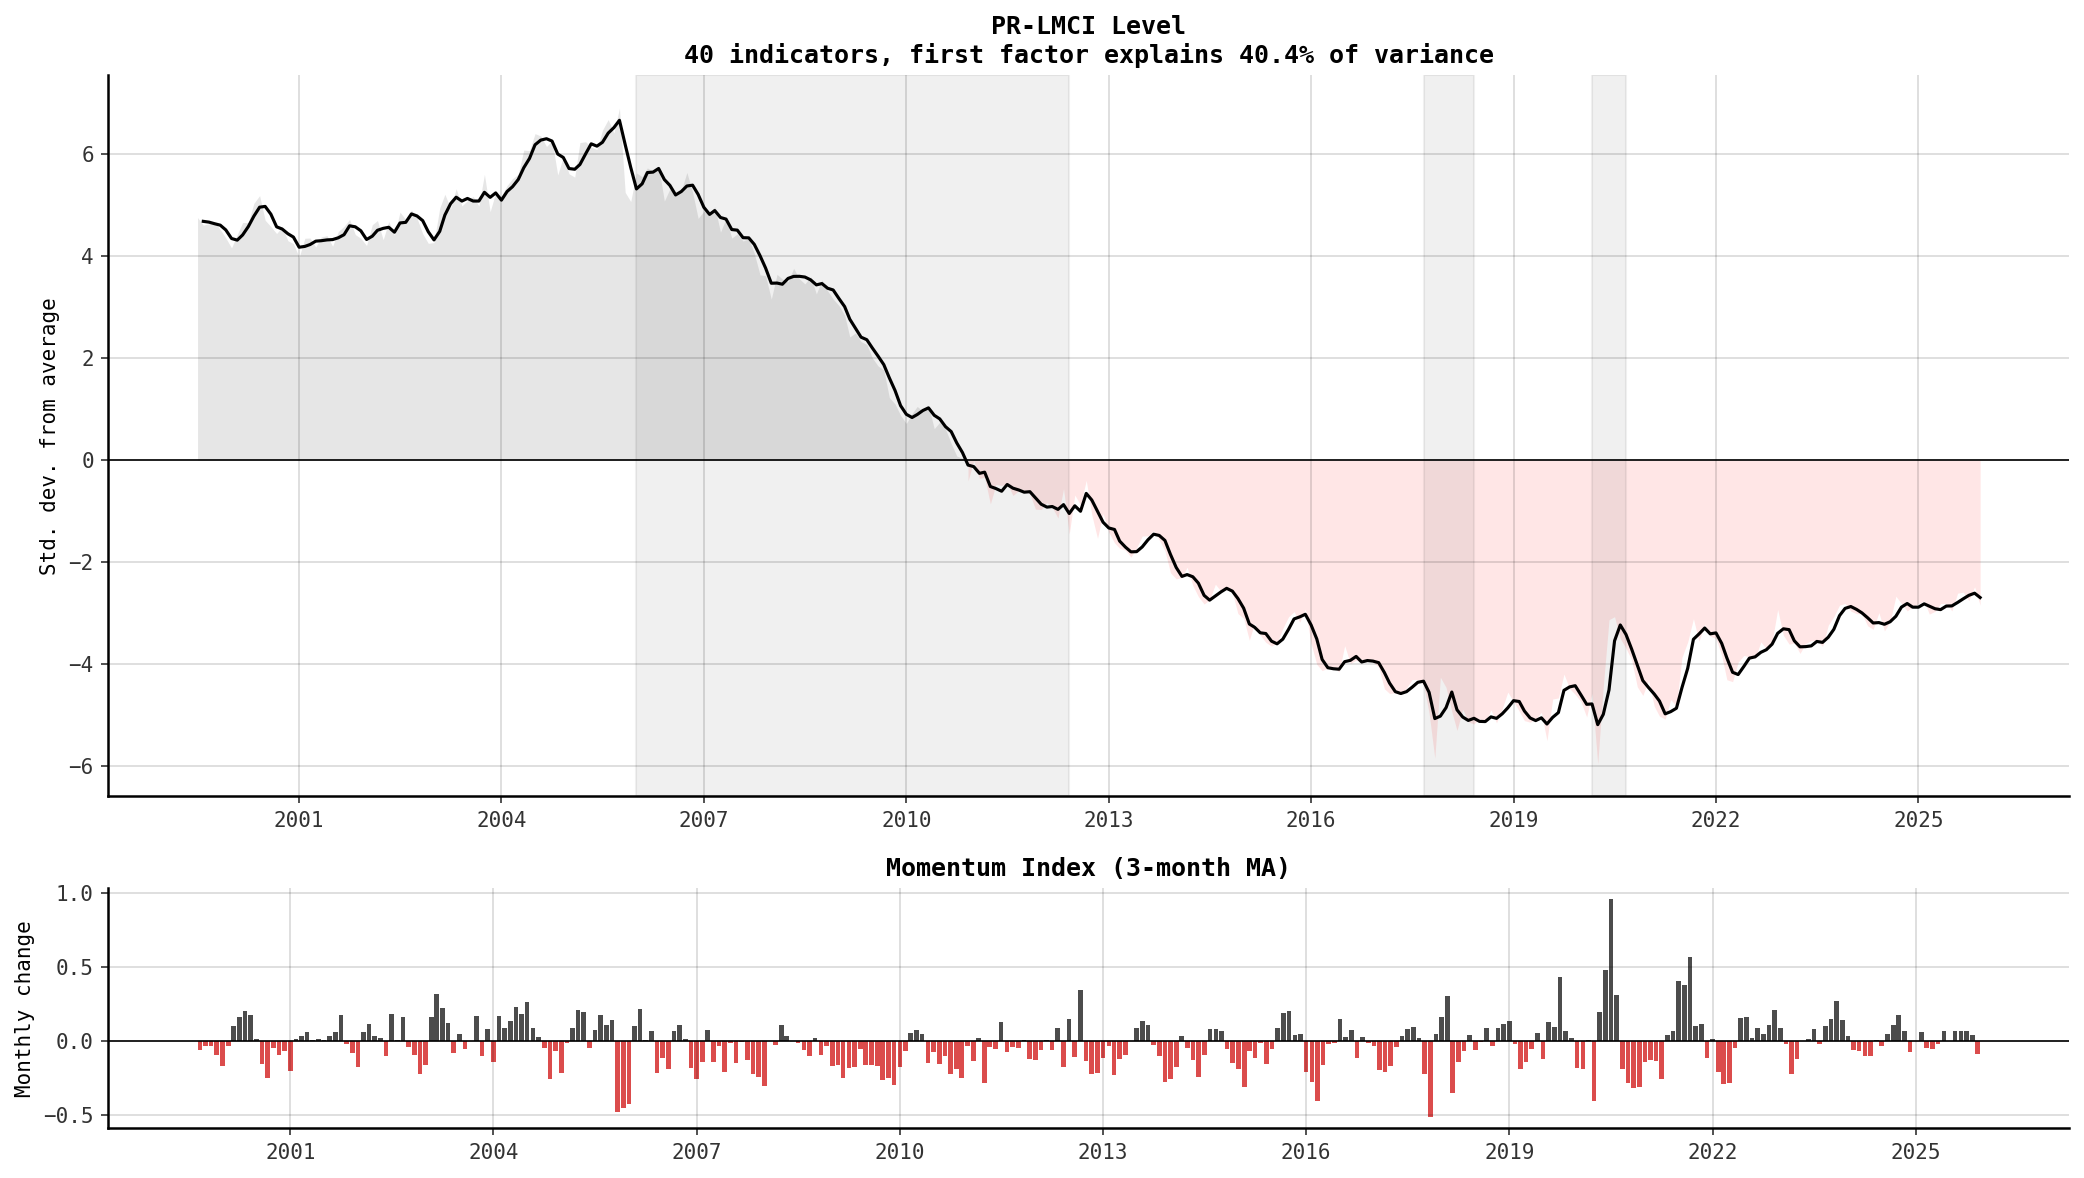
- PR-LMCI Level: the level of labor market conditions (0 = historical average).
- PR-LMCI Momentum: month-over-month change in the PR-LMCI level.
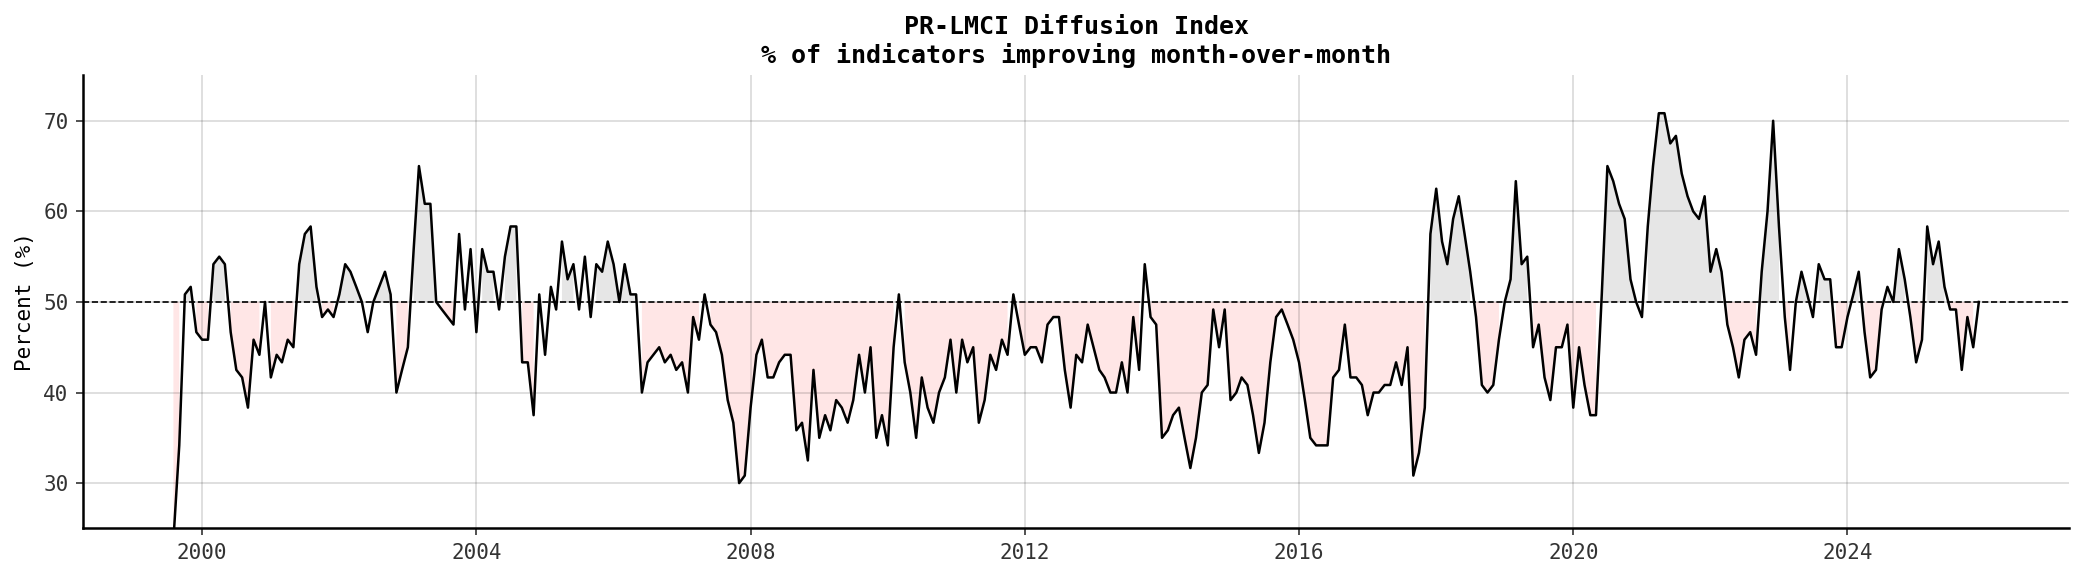
- Diffusion Index: % of indicators improving (above 50% = broad-based).
Indicator categories: the curated panel spans the groups below. Indicators lacking sufficient history are dropped each release, leaving 39 series in the latest index.
- Non-farm payroll employment by NAICS sector
- Labor force, employment, unemployment, participation rate
- Job flows: BED gross gains, gross losses, net change
- Unemployment insurance claims: initial and continued
- Tourism: non-resident registrations, hotel occupancy, SJU airport passengers
- Construction: cement production, building permits, foreclosures
- Trade: exports, imports, cargo throughput
- Consumer demand: auto sales, gas consumption, vehicle registrations
- Fiscal: income tax, excise taxes, motor vehicle tax
- Energy: industrial and residential electric power consumption
- Other: total bankruptcies, PR Economic Activity Index
Data sources:
- Puerto Rico Planning Board (Junta de Planificacion) — monthly economic indicators
- PR Dept. of Labor, LMI Division — Business Employment Dynamics (job flows)
- US Dept. of Labor, ETA — Weekly unemployment insurance claims
- PR Dept. of Economic Development (DDEC) — Auto sales
Latest Reading April 2026 (preliminary)
Here are the latest estimates for April 2026:
Preliminary. The April 2026 reading is based on partial data — 72% of indicators reported and will be revised as additional indicators are released.
| Latest (April 2026) |
Previous Month (Mar 2026) |
Year Ago (Apr 2025) |
|
|---|---|---|---|
| PR-LMCI Level | -3.15 | -3.16 | -2.88 |
| PR-LMCI Momentum | +0.01 | +0.03 | -0.03 |
| Diffusion Index | 52.1% | 49.6% | 51.3% |
| Hiring Rate | 1.44% | 1.58% | 1.44% |
| Separations Rate | 1.55% | 1.57% | 1.35% |
| Prob. Improving | 52% | -- | |
The Puerto Rico Labor Market Conditions Index (PR-LMCI) was little changed at -3.15 in April 2026, indicating that labor market conditions are below average. The PR-LMCI Momentum registered +0.01, suggesting conditions are stable. The index has been below its historical average for 184 consecutive months (see PR-LMCI Level below). The April 2026 reading is preliminary (72% of indicators reported) and will be revised as additional data arrive.
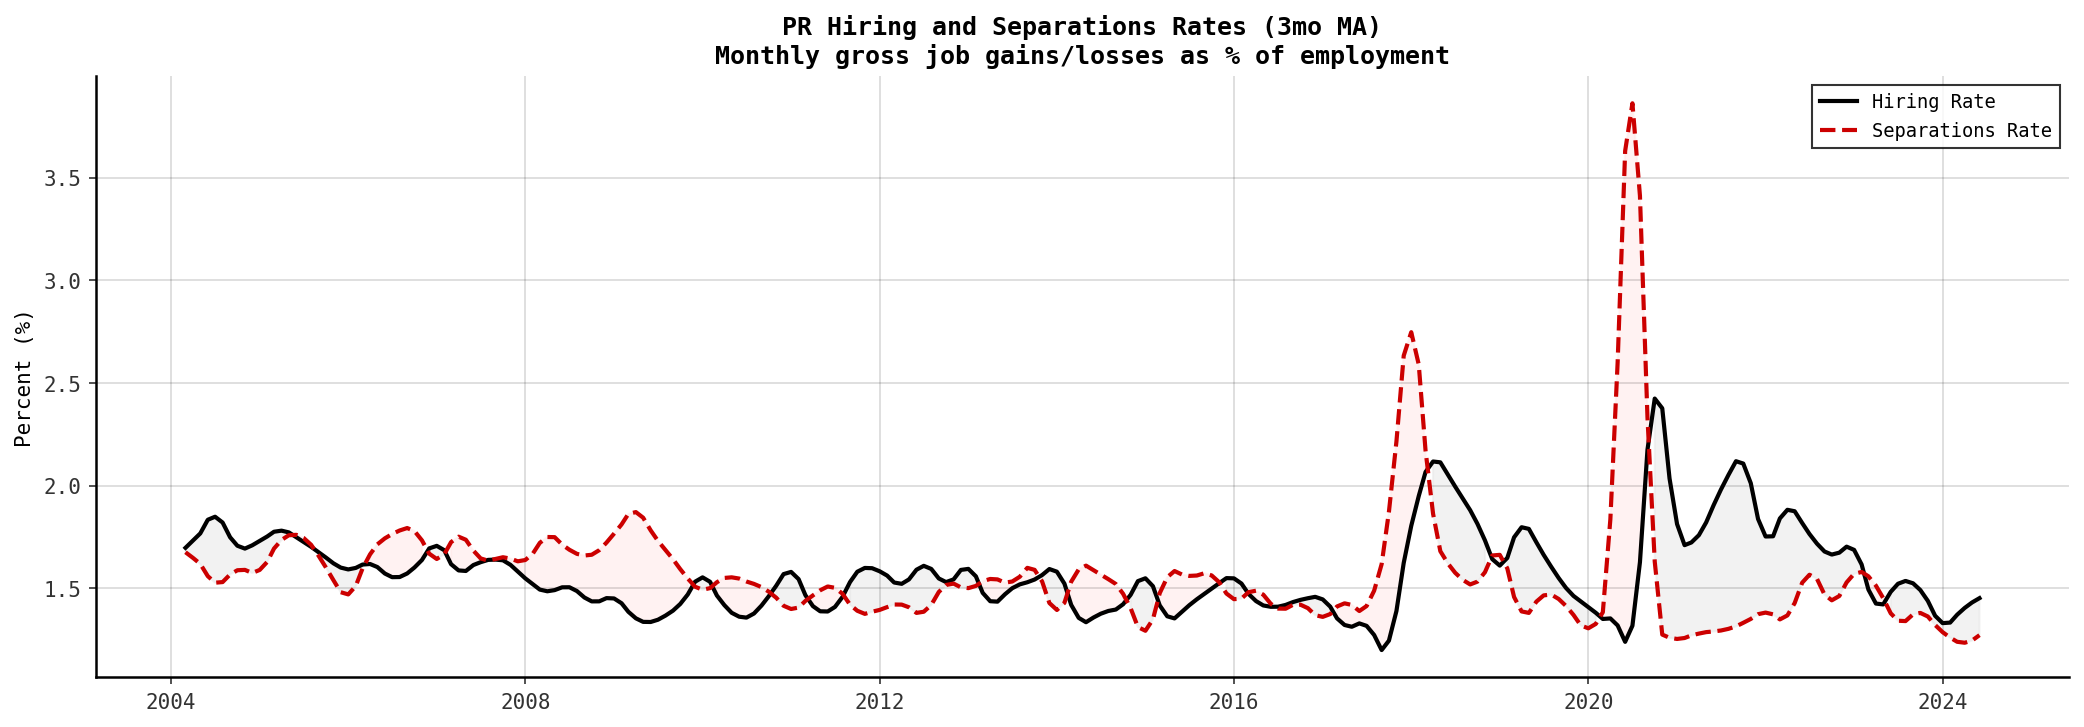
The hiring rate, which measures gross job gains as a share of employment, stood at 1.44% in the latest period, below its 12-month average of 1.53%. The separations rate registered 1.55%, with separations exceeding hiring. The net flow rate of -0.11 percentage points suggests net employment contraction (see Hiring and Separations Rates below).
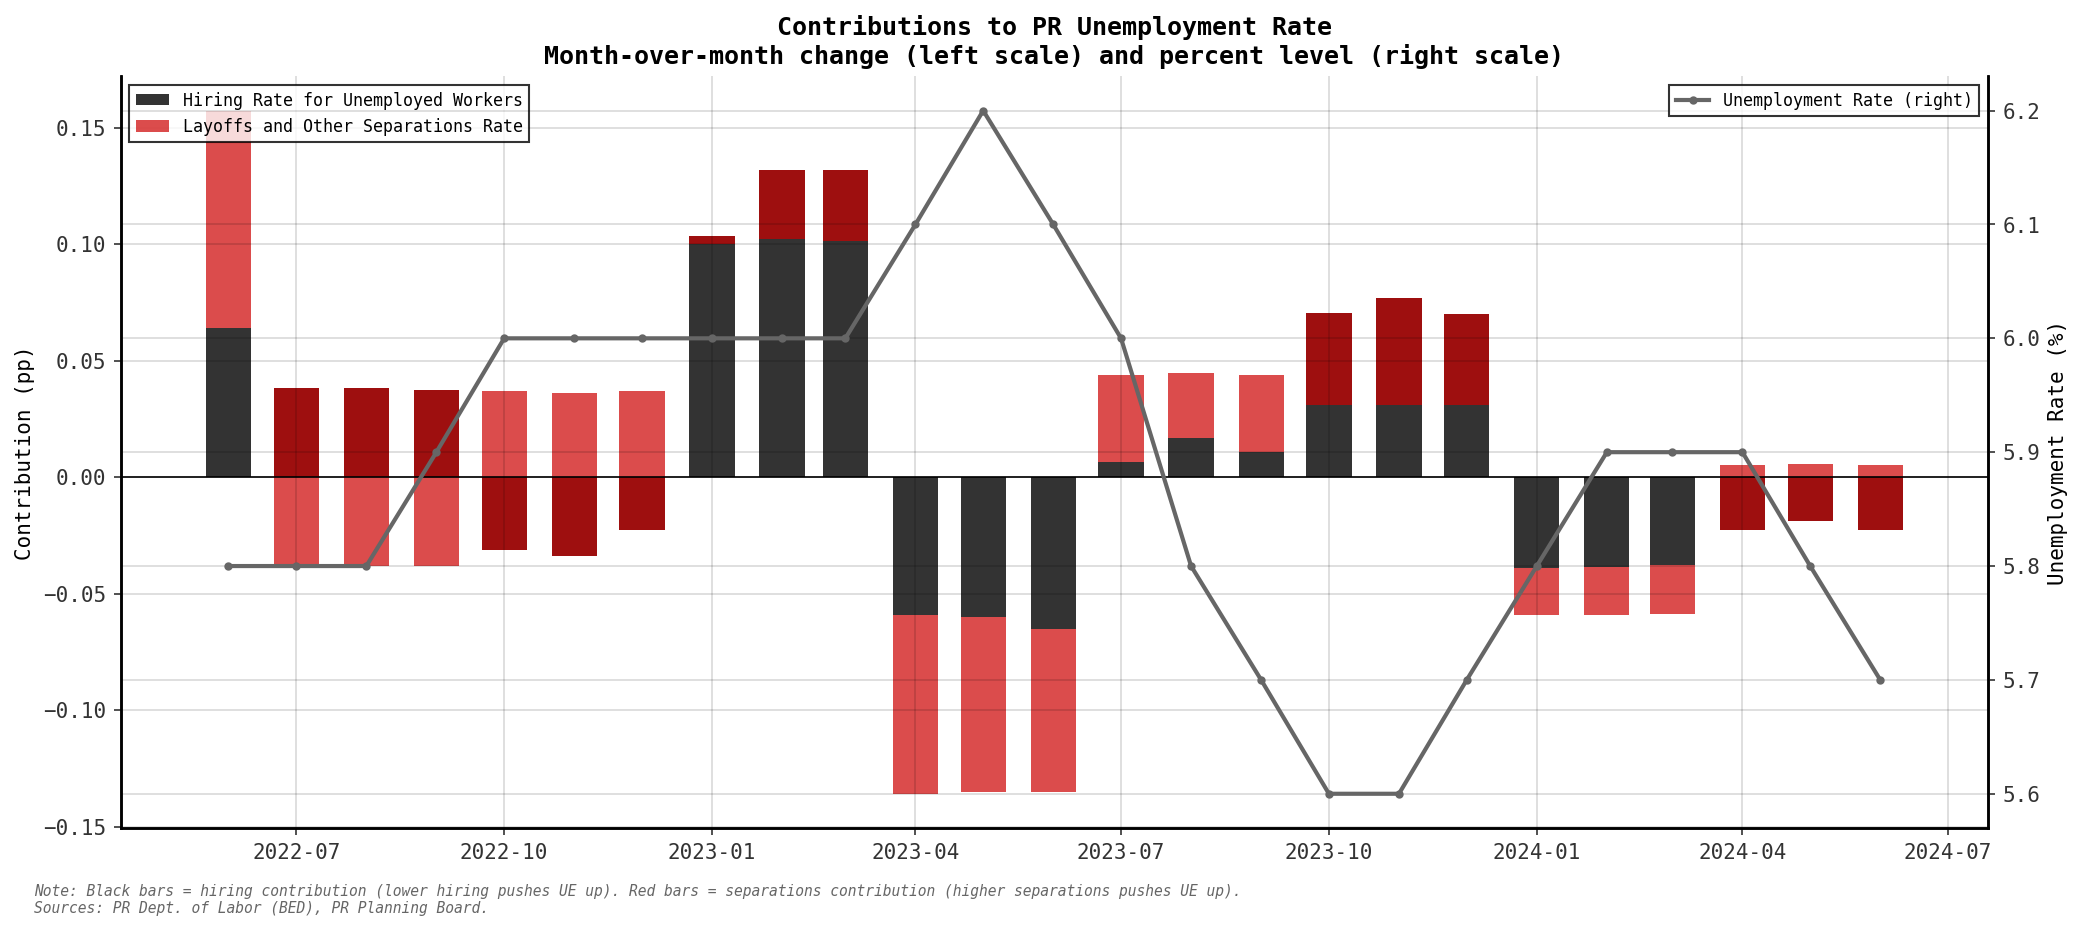
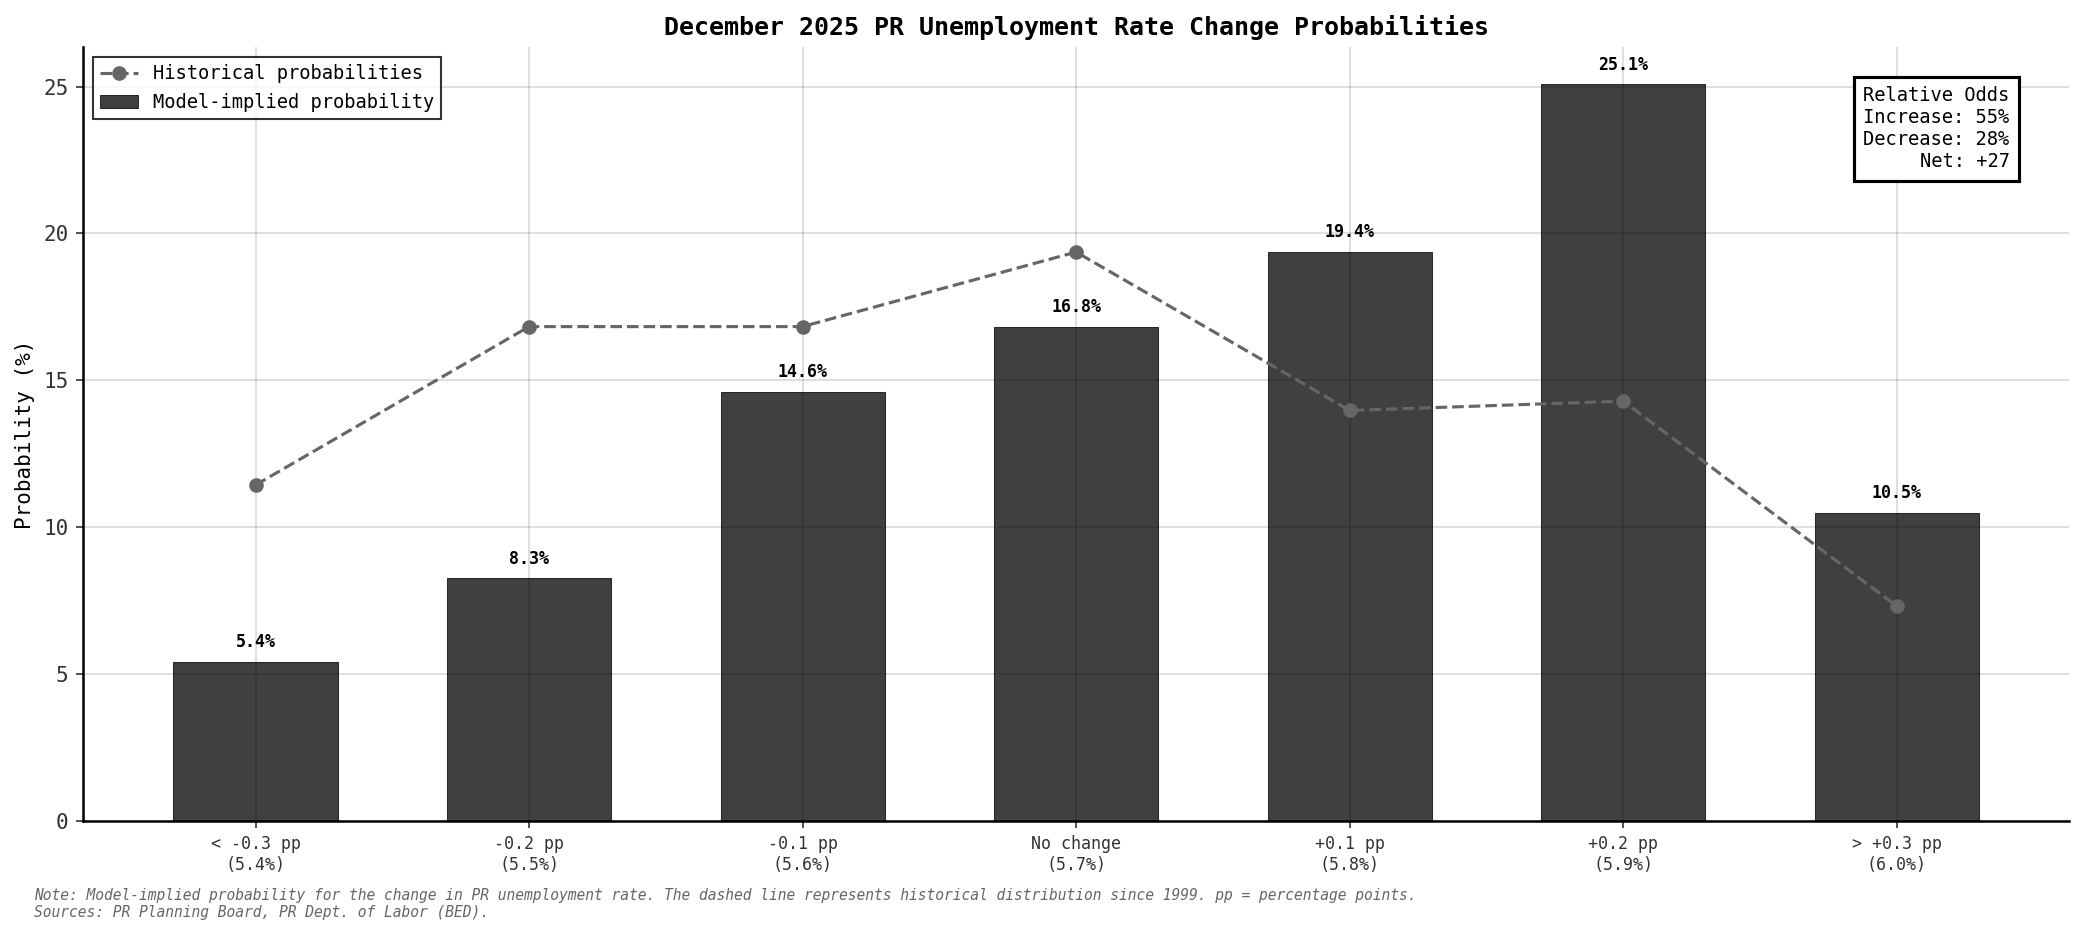
The unemployment rate was unchanged to 5.6% in the latest period. Over the past three months, changes in the hiring rate have been the dominant driver of unemployment rate movements (see Contributions to Unemployment Rate below). Looking ahead, the model-implied probability distribution suggests decrease more likely: 45% odds of a decrease, 19% odds of no change, and 35% odds of an increase (see Unemployment Rate Change Probabilities below).
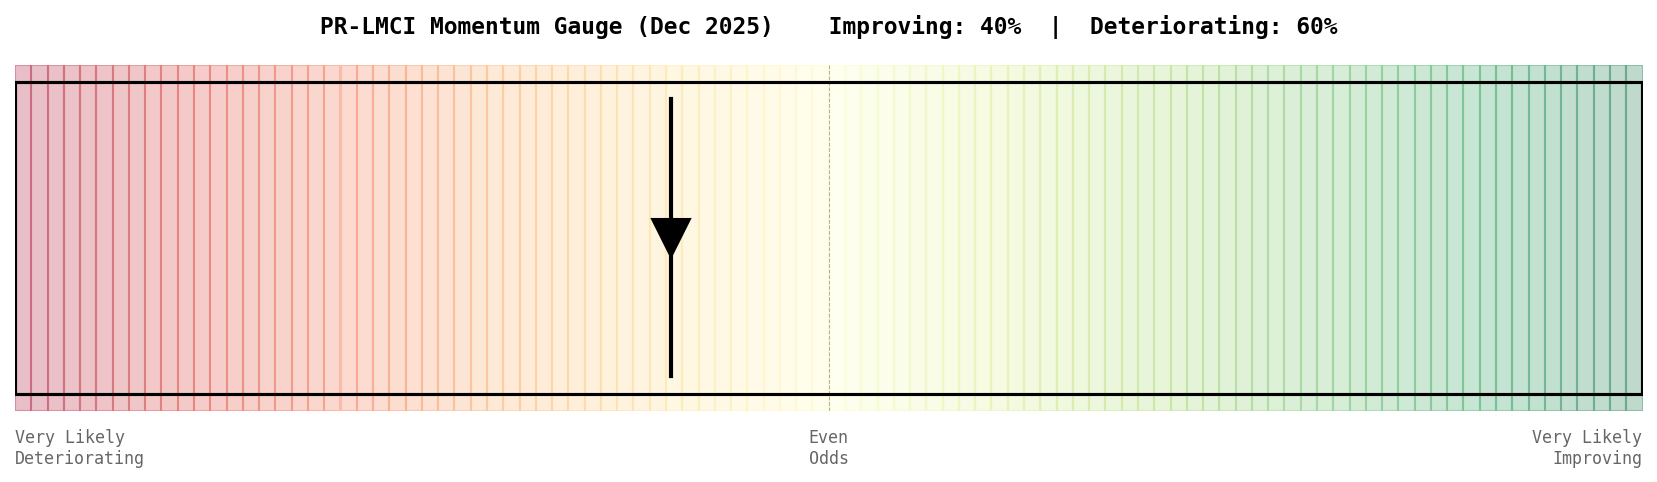
The diffusion index, which measures the share of indicators improving month-over-month, stood at 52.1%, indicating mixed conditions (see Diffusion Index below). The Momentum Gauge suggests a 52% probability that conditions will improve in the coming month, versus 48% for deterioration.
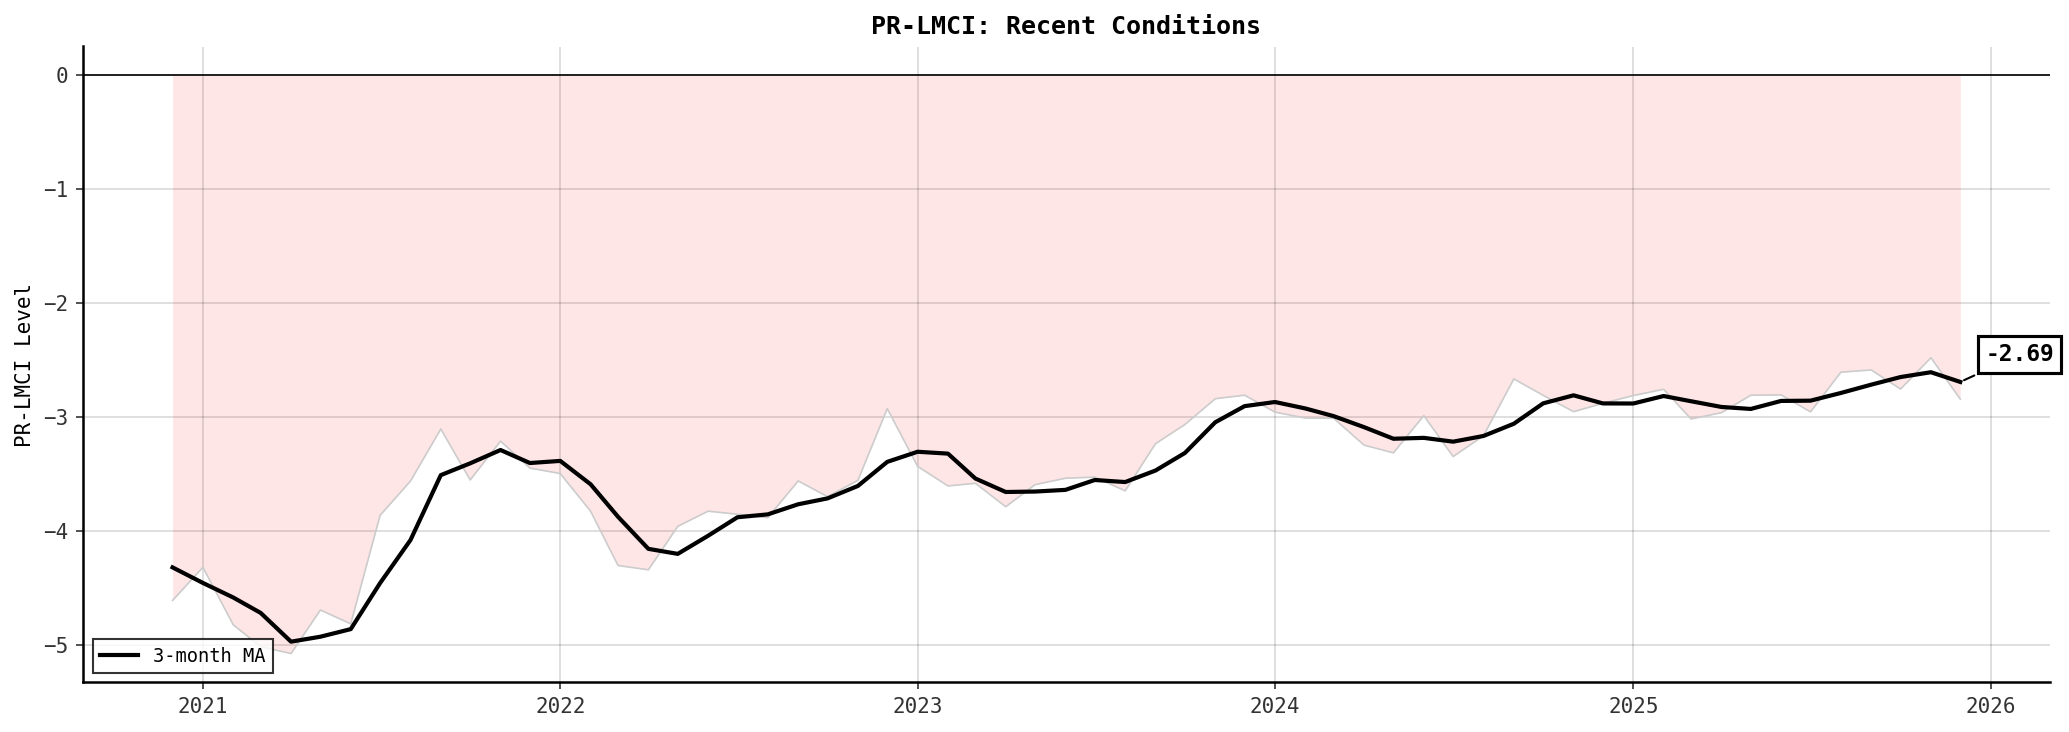
The current reading places PR labor market conditions at the 30th percentile of all observations since 1999, below the median of historical readings. For comparison, the average PR-LMCI was -3.73 in the pre-Maria period (2015-2017), -4.76 in the post-Maria/pre-COVID period, and -3.24 since mid-2021. The index is currently most influenced by economic activity index, cement production, government - sa (thousands of persons (sa)) (pro-cyclical) and education and health services, professional and business services, excise taxes (counter-cyclical). (See Recent Conditions below.)
Hiring and Separations Rates Inflow and outflow rates of employment
What these measure: The hiring rate (black solid) measures gross job gains as a share of total employment. The separations rate (red dashed) measures gross job losses. When hiring exceeds separations, employment is expanding. The shaded area shows the gap.
Data source: PR Business Employment Dynamics (quarterly, interpolated to monthly).
Contributions to Unemployment Rate Hiring vs separations decomposition
How to read: Black bars show the contribution of hiring (lower hiring pushes UE up). Red bars show the contribution of separations (higher separations pushes UE up). The line on the right axis tracks the actual unemployment rate level.
Unemployment Rate Change Probabilities Model-implied vs historical
How to read: Black bars show the model-implied probability for each range of next-month unemployment rate changes. The dashed line shows the historical distribution since 1999. When model-implied probabilities exceed historical benchmarks, that outcome is more likely than usual. The relative odds box summarizes the balance of risks.
Momentum Gauge Probability of improvement vs deterioration
How to read: The marker shows the model-implied probability that labor market conditions will improve next month. When the marker is right of center, improvement is more likely than deterioration.
PR-LMCI Level Level of labor market conditions over time
How to read: Values above zero indicate above-average conditions; below zero indicates below-average. The 3-month moving average smooths monthly noise. Grey bands mark the 2006-2012 recession, Hurricane Maria, and COVID-19.
Recent Conditions Last 5 years
What you see: A close-up of the PR-LMCI with the current reading annotated.
Diffusion Index Breadth of improvement across indicators
How to read: The diffusion index measures what fraction of the 39 input indicators improved month-over-month. Values above 50% indicate that more indicators are improving than deteriorating (broad-based improvement). Currently at 52.1%.
Methodology Technical note
The PR-LMCI adapts the methodology of the Chicago Fed Labor Market Indicators (Brave, Butters, and Kelley, 2019) to Puerto Rico using locally available data.
Factor model. The PR-LMCI level is the first principal component extracted from a standardized panel of 39 monthly indicators using Expectation-Maximization PCA (EM-PCA), which handles missing observations and ragged edges common in Puerto Rico data releases. The index is normalized so that zero represents the historical average. The PR-LMCI Momentum is the first difference of the level.
Diffusion index. The share of the 39 input indicators that improved month-over-month, smoothed with a 3-month moving average. Values above 50% indicate broad-based improvement.
Labor flows. Hiring and separations rates are derived from the PR Business Employment Dynamics (BED) program, which reports quarterly gross job gains and losses. Quarterly flows are converted to monthly rates by dividing by 3, then expressed as a percentage of total non-farm employment. The contributions to unemployment rate change decompose month-over-month UE changes into the portions attributable to changes in the hiring rate (downward pressure when hiring increases) and the separations rate (upward pressure when separations increase).
Probability forecasts. The unemployment rate change probability distribution compares model-implied probabilities (based on recent flow dynamics) against the historical distribution of monthly UE changes since 1999. The momentum gauge summarizes the net balance of improvement vs. deterioration risk based on the recent trajectory of the PR-LMCI.
Key differences from the Chicago Fed. The Chicago Fed uses Current Population Survey (CPS) microdata and real-time private sector data (ADP, Indeed, Google Trends, Morning Consult) combined via partial least squares (PLS). These sources are not available for Puerto Rico. Instead, the PR-LMCI uses a curated panel of 39 indicators drawn from the PR Planning Board, BED job flows, DOL unemployment insurance claims, and DDEC auto sales as inputs to a standard PCA factor model. Indicators were selected through a multi-evaluator consensus process prioritizing non-redundancy, category balance, and minimum sample size.
References:
- Brave, S. A., R. A. Butters, and D. Kelley (2019), "A New 'Big Data' Index of U.S. Economic Activity," Economic Perspectives, Federal Reserve Bank of Chicago, No. 1.
- Brave, S. A. and J. R. A. Cole (2014), "Labor Market Conditions Index: LMCI Methodology," Chicago Fed, unpublished.
- Shimer, R. (2012), "Reassessing the Ins and Outs of Unemployment," Review of Economic Dynamics, 15(2), pp. 127-148.
Data Download the full time series
The PR-LMCI data is available for download in CSV format.
- PR-LMCI index — activity, momentum, diffusion (monthly)